
Flink Metrics REST API使用
Flink Metrics REST API使用
Operator Metrics采集
- idletime
- numRecords
- queueLen
TaskManager Metrics采集
Flink基于JVM运行,对TM Metrics的分析实际上就是在进程及线程级别进行分析。
Flink采集TM的JVM指标时,是通过java自己的OperatingSystemMXBean来进行采集的,具体如下:
JVM CPU负载情况
Flink部分源码
1 | // org/apache/flink/runtime/metrics/util/MetricUtils.java |
jvm提供的getProcessCpuLoad()方法,介绍如下
返回Java虚拟机进程的“最近cpu使用量”。该值是[0.0,1.0]区间内的一个双精度值。0.0的值表示在最近观察的时间段内没有一个cpu运行来自JVM进程的线程,而1.0的值表示在最近观察的时间段内,所有cpu 100%都在活跃地运行来自JVM进程的线程。来自JVM的线程包括应用程序线程和JVM内部线程。根据JVM进程和整个系统中正在进行的活动,0.0到1.0之间的所有值都是可能的。如果Java虚拟机最近的CPU占用率不可用,该方法返回一个负数。
Returns the “recent cpu usage” for the Java Virtual Machine process. This value is a double in the [0.0,1.0] interval. A value of 0.0 means that none of the CPUs were running threads from the JVM process during the recent period of time observed, while a value of 1.0 means that all CPUs were actively running threads from the JVM 100% of the time during the recent period being observed. Threads from the JVM include the application threads as well as the JVM internal threads. All values betweens 0.0 and 1.0 are possible depending of the activities going on in the JVM process and the whole system. If the Java Virtual Machine recent CPU usage is not available, the method returns a negative value.
该方法返回整个JVM的CPU使用情况,要想获得进程级别的需要考虑其他方法。
- 可以通过jps获得TaskManager的进程ID
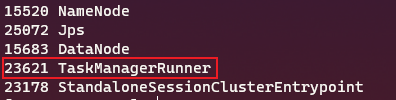
- 然后根据进程ID通过
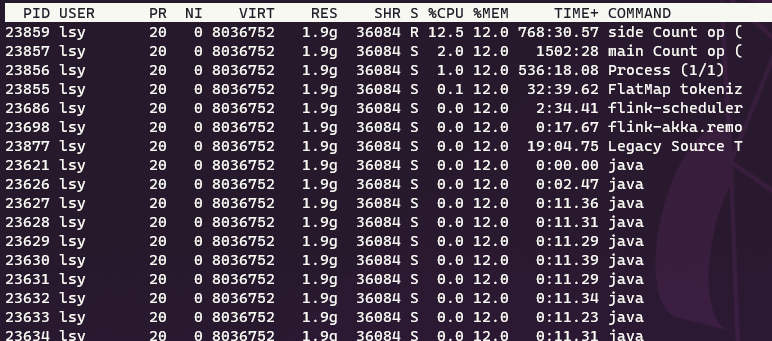
top -H -p 23621可以看到线程对CPU的使用情况,这里可以看到每一个算子都是一个线程,但是使用程序导出时应考虑一下其他命令
JVM 内存使用情况
JVM 内存类型
参考https://docs.oracle.com/javase/8/docs/api/java/lang/management/MemoryMXBean.html
Heap
Java虚拟机有一个堆,它是运行时数据区域,所有类实例和数组的内存都从这个堆中分配。它在Java虚拟机启动时创建。对象的堆内存由被称为垃圾收集器的自动内存管理系统回收。
堆的大小可以固定,也可以扩展或收缩。堆的内存不需要是连续的。
The Java virtual machine has a heap that is the runtime data area from which memory for all class instances and arrays are allocated. It is created at the Java virtual machine start-up. Heap memory for objects is reclaimed by an automatic memory management system which is known as a garbage collector.
The heap may be of a fixed size or may be expanded and shrunk. The memory for the heap does not need to be contiguous.
Non-Heap
Java虚拟机管理堆以外的内存(称为非堆内存)。
Java虚拟机有一个在所有线程之间共享的方法区域。方法区域属于非堆内存。它存储每个类的结构,比如运行时常量池、字段和方法数据,以及方法和构造函数的代码。它在Java虚拟机启动时创建。
方法区域在逻辑上是堆的一部分,但是Java虚拟机实现可以选择不进行垃圾收集或压缩它。与堆类似,方法区域可以是固定大小的,也可以扩展或收缩。方法区域的内存不需要是连续的。
除了方法区域,Java虚拟机实现可能需要内存用于内部处理或优化,这些内存也属于非堆内存。例如,JIT编译器需要内存来存储从Java虚拟机代码转换过来的本机机器代码,以获得高性能。
The Java virtual machine manages memory other than the heap (referred as non-heap memory).
The Java virtual machine has a method area that is shared among all threads. The method area belongs to non-heap memory. It stores per-class structures such as a runtime constant pool, field and method data, and the code for methods and constructors. It is created at the Java virtual machine start-up.
The method area is logically part of the heap but a Java virtual machine implementation may choose not to either garbage collect or compact it. Similar to the heap, the method area may be of a fixed size or may be expanded and shrunk. The memory for the method area does not need to be contiguous.
In addition to the method area, a Java virtual machine implementation may require memory for internal processing or optimization which also belongs to non-heap memory. For example, the JIT compiler requires memory for storing the native machine code translated from the Java virtual machine code for high performance.
MemoryUsage
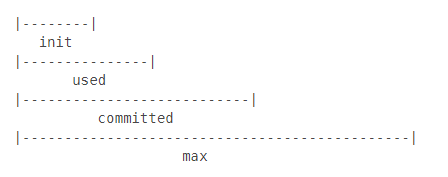
MemoryUsage对象包含四部分
init
表示Java虚拟机在启动期间从操作系统请求内存管理的初始内存量(以字节为单位)。Java虚拟机可能会向操作系统请求额外的内存,也可能会随着时间的推移向系统释放内存。init的值可能是未定义的。
used
当前正在使用的内存量,字节数
committed
表示保证可由Java虚拟机使用的内存量(以字节为单位)。提交的内存数量可能会随时间变化(增加或减少)。Java虚拟机可能释放内存给系统,提交的内存可能小于init。committed总是大于或等于used。
max
表示可用于内存管理的最大内存量(以字节为单位)。它的值可能没有定义。如果定义了最大内存量,则可能随时间而改变。如果定义了max,则已使用和提交的内存总量将始终小于或等于max。如果试图增加已用内存使其大于提交内存,这样即使used <= max仍然为true(例如,当系统的虚拟内存不足时),那么内存分配可能会失败。
对jvm内存的事情情况通过 OpenJDK管理工具获取
1 | // org/apache/flink/runtime/metrics/util/MetricUtils.java |
关于堆内存、非堆内存等内存类型参考JVM虚拟机相关内容
Status.Flink.Memory是Flink1.12.0新增加的特性
在获取Flink已用的内存大小时,是依次获得每个Slot所用的内存。
获得总计的Flink管理内存时,是直接获取配置文件中的taskmanager.memory.managed.size
TaskExecutor管理内存大小,是由memory manager管理的非堆内存大小,为排序、哈希表、中间结果缓存、RocksDB状态后端所保留的大小。
内存使用者可以从内存管理器中以MemorySegments的形式分配内存,也可以从内存管理器中保留字节,并将其内存使用保持在该边界内。如果未指定,则派生它,以构成总Flink内存的配置部分。
Managed Memory size for TaskExecutors. This is the size of off-heap memory managed by the memory manager, reserved for sorting, hash tables, caching of intermediate results and RocksDB state backend. Memory consumers can either allocate memory from the memory manager in the form of MemorySegments, or reserve bytes from the memory manager and keep their memory usage within that boundary. If unspecified, it will be derived to make up the configured fraction of the Total Flink Memory.
1 | // org/apache/flink/runtime/metrics/util/MetricUtils.java |
JVM垃圾回收情况
垃圾回收可以获得回收的次数以及总时间,其中
1 | GarbageCollectorMXBean::getName |
TM网络情况
这里会采集TM所用的网络内存的相关信息https://ci.apache.org/projects/flink/flink-docs-release-1.12/ops/metrics.html#default-shuffle-service
通过下面的Flink源码增加了相关的Metrics
1 | // org/apache/flink/runtime/io/network/metrics/NettyShuffleMetricFactory.java |
getTotalNumberOfMemorySegments与taskmanager.memory.network.min配置项相关
TaskExecutors的最小网络内存大小。网络内存是为ShuffleEnvironment预留的堆外内存(例如,网络缓冲区)。网络内存大小是由总链接内存的配置部分组成的。如果导出的大小小于/大于配置的最小/最大大小,则使用最小/最大大小。网络内存的确切大小可以通过设置相同的最小/最大值来显式指定
Min Network Memory size for TaskExecutors. Network Memory is off-heap memory reserved for ShuffleEnvironment (e.g., network buffers). Network Memory size is derived to make up the configured fraction of the Total Flink Memory. If the derived size is less/greater than the configured min/max size, the min/max size will be used. The exact size of Network Memory can be explicitly specified by setting the min/max to the same value.
Metrics 列表
JVM CPU指标
| Scope | Infix | Metrics | Description | Type |
|---|---|---|---|---|
| Job-/TaskManager | Status.JVM.CPU | Load | The recent CPU usage of the JVM. | Gauge |
| Time | The CPU time used by the JVM. | Gauge |
JVM Memory
| Scope | Infix | Metrics | Description | Type |
|---|---|---|---|---|
| Job-/TaskManager | Status.JVM.Memory | Heap.Used | The amount of heap memory currently used (in bytes). | Gauge |
| Heap.Committed | The amount of heap memory guaranteed to be available to the JVM (in bytes). | Gauge | ||
| Heap.Max | The maximum amount of heap memory that can be used for memory management (in bytes). This value might not be necessarily equal to the maximum value specified through -Xmx or the equivalent Flink configuration parameter. Some GC algorithms allocate heap memory that won’t be available to the user code and, therefore, not being exposed through the heap metrics. | Gauge | ||
| NonHeap.Used | The amount of non-heap memory currently used (in bytes). | Gauge | ||
| NonHeap.Committed | The amount of non-heap memory guaranteed to be available to the JVM (in bytes). | Gauge | ||
| NonHeap.Max | The maximum amount of non-heap memory that can be used for memory management (in bytes). | Gauge | ||
| Metaspace.Used | The amount of memory currently used in the Metaspace memory pool (in bytes). | Gauge | ||
| Metaspace.Committed | The amount of memory guaranteed to be available to the JVM in the Metaspace memory pool (in bytes). | Gauge | ||
| Metaspace.Max | The maximum amount of memory that can be used in the Metaspace memory pool (in bytes). | Gauge | ||
| Direct.Count | The number of buffers in the direct buffer pool. | Gauge | ||
| Direct.MemoryUsed | The amount of memory used by the JVM for the direct buffer pool (in bytes). | Gauge | ||
| Direct.TotalCapacity | The total capacity of all buffers in the direct buffer pool (in bytes). | Gauge | ||
| Mapped.Count | The number of buffers in the mapped buffer pool. | Gauge | ||
| Mapped.MemoryUsed | The amount of memory used by the JVM for the mapped buffer pool (in bytes). | Gauge | ||
| Mapped.TotalCapacity | The number of buffers in the mapped buffer pool (in bytes). | Gauge | ||
| Status.Flink.Memory | Managed.Used | The amount of managed memory currently used. | Gauge | |
| Managed.Total | The total amount of managed memory. | Gauge |
GarbageCollection
| Scope | Infix | Metrics | Description | Type |
|---|---|---|---|---|
| Job-/TaskManager | Status.JVM.GarbageCollector | The total number of collections that have occurred. | Gauge | |
| The total time spent performing garbage collection. | Gauge |
使用RestAPI获取TM JVM性能指标
CPU
url: http://<jobmanager>:<port>/taskmanagers/:taskmanagerid/metrics
params:
Status.JVM.CPU.TimeStatus.JVM.CPU.Load获取jvm进程的CPU负载,要想获得线程级的需要进一步考虑
System Metrics采集
基本信息
Flink使用OSHI来采集系统硬件信息
CPU使用率获取方式
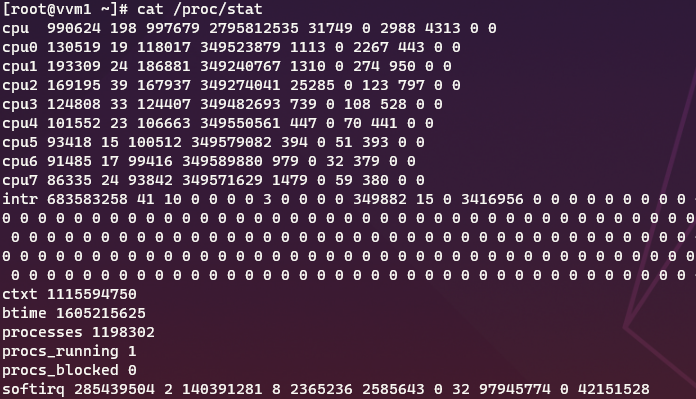
Flink中关于CPU负载部分的采集源码如下,其中getSystemCpuLoadTicks()方法为OSHI的方法。
该方法返回的指标中,irq为Hardware interrupts,SoftIRQ为Software interrupts。
oshi访问/proc/stat文件获取CPU信息
/proc/stat文件部分截图
重要
oshi在对cpuUsage使用的getSystemCpuLoad()方法调用了调用了com.sun.management.OperatingSystemMXBean中的getSystemCpuLoad()方法来获得负载。该方法说明如下:
返回整个系统的“最近的CPU使用情况”。 此值是[0.0,1.0]区间中的小数。 值0.0表示在最近观察到的时间内所有CPU都处于空闲状态,而值1.0表示在观察到的最近一段时间内所有CPU 100%处于活动状态。 介于0.0到1.0之间的所有值都是可能的,具体取决于系统中正在进行的活动。 如果系统最近的CPU使用率不可用,则该方法返回负值。
Returns the “recent cpu usage” for the whole system. This value is a double in the [0.0,1.0] interval. A value of 0.0 means that all CPUs were idle during the recent period of time observed, while a value of 1.0 means that all CPUs were actively running 100% of the time during the recent period being observed. All values betweens 0.0 and 1.0 are possible depending of the activities going on in the system. If the system recent cpu usage is not available, the method returns a negative value.
1 | // org/apache/flink/runtime/metrics/util/SystemResourcesCounter.java |
内存使用率获取方式
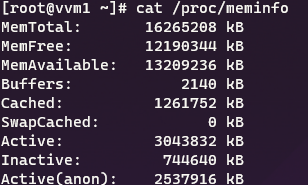
oshi访问文件/proc/meminfo来获取内存信息
/proc/meminfo文件部分截图
1 | // org/apache/flink/runtime/metrics/util/SystemResourcesMetricsInitializer.java |
swap交换分区使用率获取方式
oshi访问文件/proc/meminfo来获取内存信息,与获取内存使用相同
这里直接调用oshi的getSwapUsed方法,在oshi中,SwapUsed是通过/proc/meminfo文件中的Total和Free相减得到的。
Swap的使用,能表现出系统内存是否够用,如果频繁使用Swap,则表示系统内存不足。

1 | // org/apache/flink/runtime/metrics/util/SystemResourcesMetricsInitializer.java |
网络使用情况获取方式
oshi通过getNetworkIFs()方法获取网络接口列表,包括本地接口。访问以下这些文件获取接口数据。
1 | // oshi/hardware/platform/linux/LinuxNetworks.java |
在Flink中,获得每个接口的发送接收的速率。
1 | // org/apache/flink/runtime/metrics/util/SystemResourcesMetricsInitializer.java |
配置Flink
1 | # FLINK_HOME/lib文件夹下 |
Metrics列表
System CPU
| Scope | Infix | Metrics | Description |
|---|---|---|---|
| Job-/TaskManager | System.CPU | Usage | 总体CPU使用。Overall % of CPU usage on the machine. |
| Idle | CPU空闲半分比,% of CPU Idle usage on the machine. | ||
| Sys | CPU内核时间占用百分比,% of System CPU usage on the machine. | ||
| User | CPU用户空间占用百分比,% of User CPU usage on the machine. | ||
| IOWait | CPU等待输入输出百分比,% of IOWait CPU usage on the machine. | ||
| Irq | % of Irq CPU usage on the machine. | ||
| SoftIrq | % of SoftIrq CPU usage on the machine. | ||
| Nice | % of Nice Idle usage on the machine. | ||
| Load1min | Average CPU load over 1 minute | ||
| Load5min | Average CPU load over 5 minute | ||
| Load15min | Average CPU load over 15 minute | ||
| UsageCPU* | % of CPU usage per each processor |
System memory
| Scope | Infix | Metrics | Description |
|---|---|---|---|
| Job-/TaskManager | System.Memory | Available | Available memory in bytes |
| Total | Total memory in bytes | ||
| System.Swap | Used | Used swap bytes | |
| Total | Total swap in bytes |
System network
| Scope | Infix | Metrics | Description |
|---|---|---|---|
| Job-/TaskManager | System.Network.INTERFACE_NAME | ReceiveRate | Average receive rate in bytes per second |
| SendRate | Average send rate in bytes per second |
使用REST API获取TM系统性能指标
举例部分API
获取TM列表
url: http://<jobmanager>:<port>/taskmanagers
获取TM系统信息
CPU
url: http://<jobmanager>:<port>/taskmanagers/:taskmanagerid/metrics
params:
System.CPU.Usage,这一指标显示可能与Top不同System.CPU.Idle,采集空闲指标
Memory
url: http://<jobmanager>:<port>/taskmanagers/:taskmanagerid/metrics
params:
System.Memory.Total,字节数System.Memory.Available,采集空闲内存,字节数System.Swap.Used,使用Swap是否被使用,来考虑系统内存是否足够用,如果系统内存不足,则会使用Swap分区System.Swap.Total,
Network
url: http://<jobmanager>:<port>/taskmanagers/:taskmanagerid/metrics
params:
System.Network.<interface_name>.ReceiveRate,每秒字节数System.Network.<interface_name>.SendRate,发送字节数